

How the Live Draw Works
The Raffle Ticket Generator for WordPress and WooCommerce has a Live Drawing / Pick a Winner feature. With a shortcode on a WordPress page you set the time of the draw and a title and description for up to 10 winners.
When the draw starts, the page cycles through the tickets entered in the raffle for as long as the shortcode says. When the time runs out, the plugin picks the winner or winners at random using PHP’s random functions.
The Test Tickets
For this study we used 731 tickets from a mix of orders. The packages held 1, 3, 5, 10, 50 and 60 tickets.
| Package | Orders | Tickets | Share of all tickets |
|---|---|---|---|
| 60 tickets | 2 | 120 | |
| 50 tickets | 7 | 350 | |
| 10 tickets | 7 | 70 | |
| 5 tickets | 16 | 80 | |
| 3 tickets | 26 | 78 | |
| 1 ticket | 33 | 33 | |
| Total | 91 | 731 | 100% |
75 Live Drawings and Their Winners
We ran 75 live draws. Here is every winner with their ticket number.
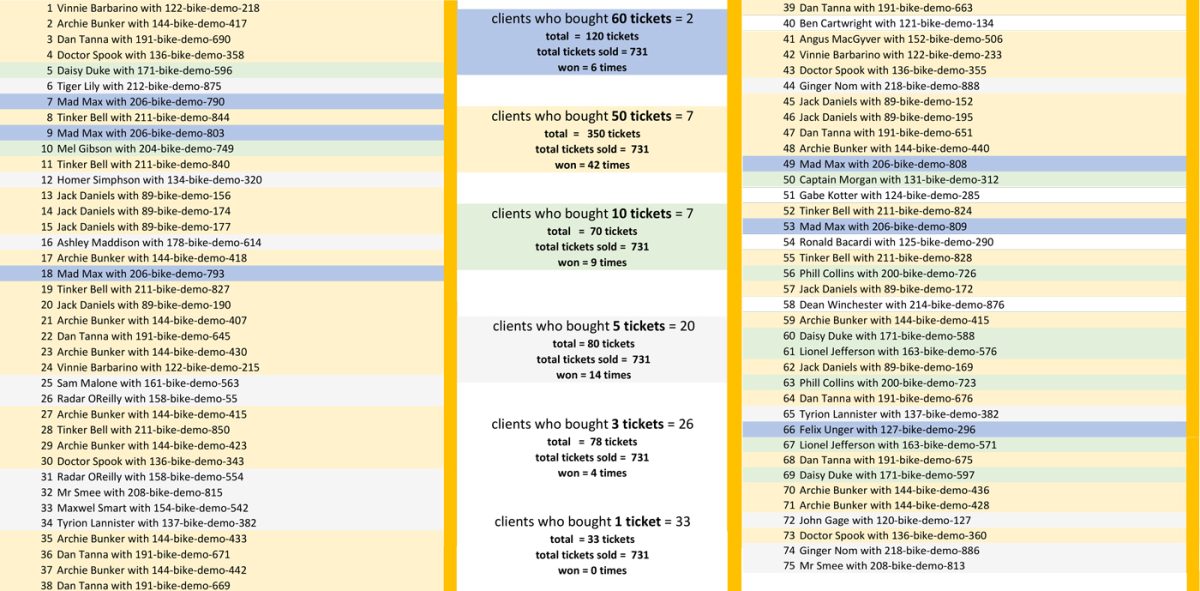
Summary of Results
| Package | Share of tickets | Winners | Share of winners |
|---|---|---|---|
| 60 tickets | 6 | ||
| 50 tickets | 42 | ||
| 10 tickets | 9 | ||
| 5 tickets | 14 | ||
| 3 tickets | 4 | ||
| 1 ticket | 0 |
No ticket won twice in 75 draws, and each package’s share of the wins followed its share of the tickets, within the swings you would expect from 75 draws. Buyers with more tickets won more often, which is exactly how a fair random draw should behave.